While the country waits for the official results of the 2020 presidential election, the New York City Board of Elections has released unofficial totals for New York City. As of Thursday, these totals include only in-person voting; counting the absentee ballots will take days, maybe weeks. We've mapped the unofficial, in-person results so you can see how your neighborhood voted:

A total of 2,346,302 in-person ballots were cast, on Election Day and the nine days of record-setting early voting.
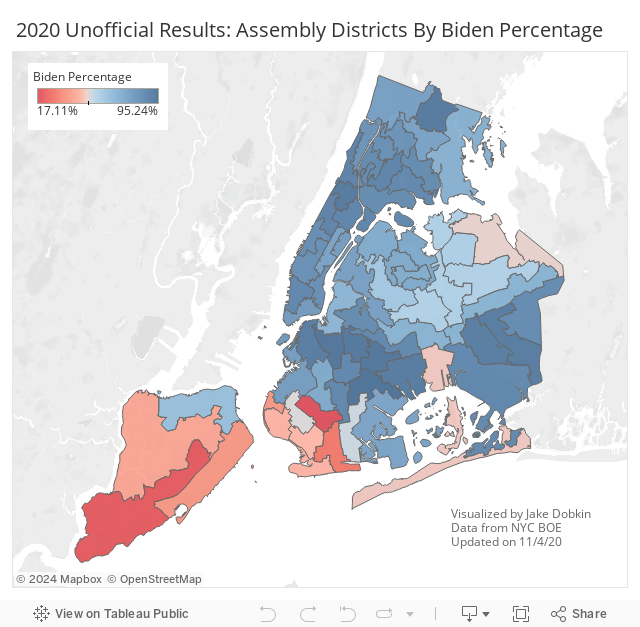
Every one of the nearly 6,000 Election Districts is part of one of about 60 Assembly Districts. Rolling up the information by Assembly District shows you how the smaller election districts add up to majorities in assembly districts, though the same red-blue pattern generally holds, with southern Staten Island, southern Brooklyn, and some parts of Queens bucking the overwhelmingly Democratic vote for the city:
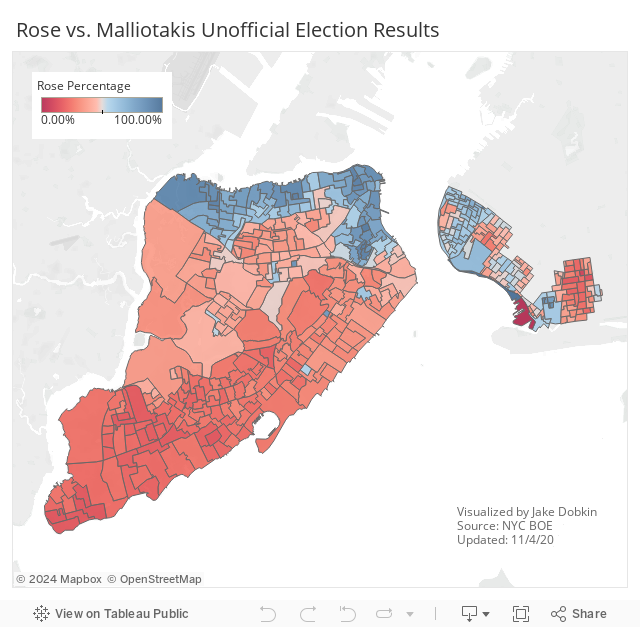
There were very few competitive local elections this year, but the Rep. Max Rose-Nicole Malliotakis race for Congressional District 11 was closely watched. Currently Malliotakis leads by about fifteen points, with 95% of the in-person results in. Looking at the numbers geographically, it's clear her strength was largely in southern Staten Island:
Let us know if there are any other local races you're curious about seeing visualized—email [email protected].
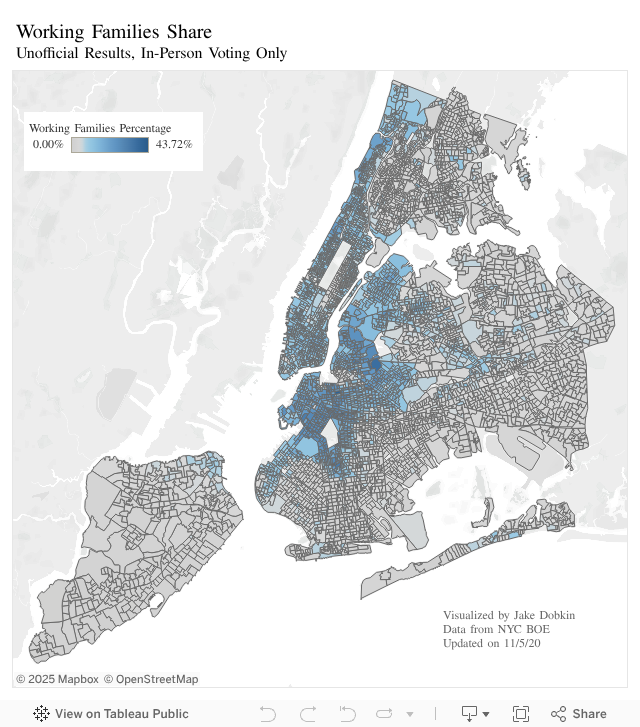
Update 8:55PM: several people have asked us to do a map showing where the Working Families Party performed well. The map shows they had a higher share of the vote mainly in Manhattan, and western Brooklyn and Queens: