

Vision Zero, Mayor de Blasio's ambitious plan to reduce the number of traffic-related deaths in NYC to zero by 2024, may not be able to meet its goal, but the numbers are certainly headed in the right direction: there were 233 traffic fatalities in 2015 compared to 269 the previous year (The Mean Streets Project puts the 2015 total at 242 fatal traffic crashes, which is still an all-time recorded low), and Commissioner Bratton is pushing for 400 to 500 additional traffic enforcement agents (to supplement the 3,000 currently on the street).
But short of dressing yourself up as a giant traffic cone or never leaving your apartment, your best chance of surviving a leisurely stroll or drive in the city is to be hyper-aware of your surroundings and try to watch out for reckless motorists. Keeping in mind there are idiot drivers everywhere, let's take a look at some of the more statistically dangerous intersections in town.
Aleksey Bilogur, a mathematics student at CUNY Baruch College, took data from the city's publicly available motor vehicle collision dataset to map out the 25 worst intersections in the city (which you can see in full at the bottom of the page).
"My analysis of this data originally focused on finding ways of reducing, specifically, accident fatality hotspots in New York City," he told us. "However, in analyzing this data I found that there was a lot that could also be said, just as interestingly, for accident occurrence hotspots."
Bilgour, who previously mined data to discover that New Yorkers are only ever 5.6 blocks from the nearest pumpkin spice latte, used information collected by the city between July 1st, 2012 and March 14th, 2016 to create the interactive graph below. You can double-click on the map to zoom in on the various intersections, which are marked by dots that increase in size according to the average number of collisions occurring there. The dots' red colors darken as each intersection's average number of crashes increases.
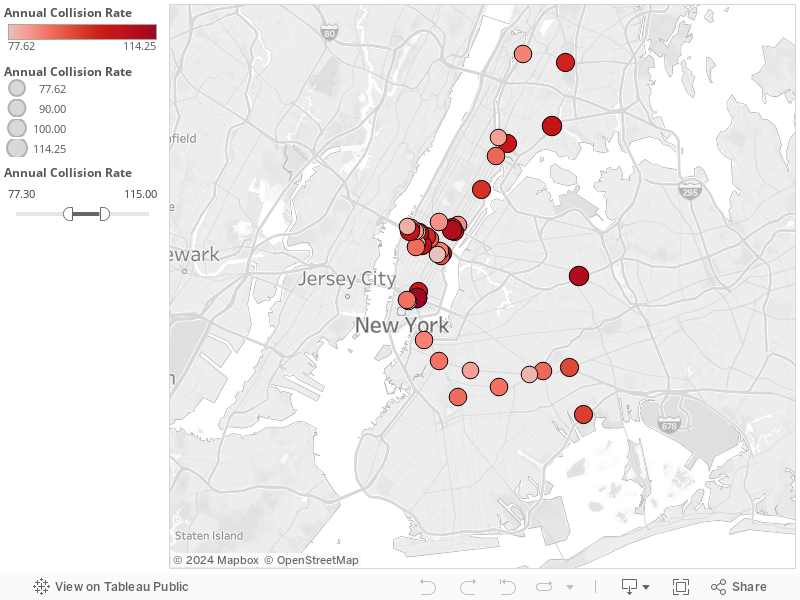
His conclusions probably won't surprise you too much: the absolute worst traffic intersections tend to be near on- and off-ramps of major bridges and tunnels, including Tillary Street and Flatbush Avenue in DUMBO, which has triple access to the Manhattan Bridge, the BQE and the Brooklyn Bridge. Also terrible: the Manhattan side of the Queensboro Bridge and the intersection of Bowery and Delancey streets, where cars from the Manhattan and Williamsburg Bridge off-ramps seem to collide (Delancey Street has long been a nightmare area for pedestrians).
Here's the full listing of the 25 intersections, along with the number of average number of collisions per year, and the approximate total number of collisions over the last four years:
1. Tillary Street and Flatbush Avenue, Brooklyn
Est. 180 collisions per year
Est. 670 collisions in the dataset
2. 2nd Avenue and East 59th Street, Manhattan
Est. 150 collisions a year
Est. 540 collisions in the dataset
3. 42nd Street and 8th Avenue, Manhattan
Est. 140 collisions a year
Est. 520 collisions in the dataset
4. Linden Boulevard and Pennsylvania Avenue, Queens
Est. 135 collisions a year
Est. 500 collisions in the dataset
5. Atlantic Avenue and Pennsylvania Avenue, Brooklyn
Est. 130 collisions a year
Est. 480 collisions in the dataset
6. The Bowery and Kenmare Street, Manhattan
Est. 115 collisions a year
Est. 420 collisions in the dataset
7. Queens Boulevard and Long Island Expressway, Queens
Est. 110 collisions a year
Est. 410 collisions in the dataset
8. 57th Street and 3rd Avenue, Manhattan
Est. 110 collisions a year
Est. 410 collisions in the dataset
9. 42nd Street and 9th Avenue, Manhattan
Est. 110 collisions a year
Est. 400 collisions in the dataset
10. 34th Street and 7th Avenue, Manhattan
Est. 110 collisions a year
Est. 400 collisions in the dataset
11. West 40th Street and 11th Avenue, Manhattan
Est. 100 collisions a year
Est. 380 collisions in the dataset
12. East 138th Street and Alexander Avenue, Bronx
Est. 100 collisions a year
Est. 380 collisions in the dataset
13. The Bowery and Houston Street, Manhattan
Est. 100 collisions a year
Est. 380 collisions in the dataset
14. East Fordham Road and Southern Boulevard, Bronx
Est. 100 collisions a year
Est. 380 collisions in the dataset
15. 2nd Avenue and East 36th Street, Manhattan
Est. 100 collisions a year
Est. 380 collisions in the dataset
16. West 42nd Street and 7th Avenue, Manhattan
Est. 100 collisions a year
Est. 380 collisions in the dataset
17. 1st Avenue and East 96th Street, Manhattan
Est. 100 collisions a year
Est. 380 collisions in the dataset
18. 3rd Avenue and East 59th Street, Manhattan
Est. 95 collisions a year
Est. 360 collisions in the dataset
19. Erksine Street and Seaview Avenue, Brooklyn
Est. 95 collisions a year
Est. 350 collisions in the dataset
20. Atlantic Avenue and Conduit Boulevard, Brooklyn
Est. 95 collisions a year
Est. 350 collisions in the dataset
21. East 34th Street and 2nd Avenue, Manhattan
Est. 90 collisions a year
Est. 340 collisions in the dataset
22. West 42nd Street and 6th Avenue, Manhattan
Est. 90 collisions a year
Est. 340 collisions in the dataset
23. East 125th Street and 2nd Avenue, Manhattan
Est. 90 collisions a year
Est. 330 collisions in the dataset
24. West 34th Street and 8th Avenue, Manhattan
Est. 90 collisions a year
Est. 330 collisions in the dataset
25. Flatbush Avenue and Empire Boulevard, Brooklyn
Est. 90 collisions a year
Est. 330 collisions in the dataset


